NZD/USD price forecast: 0.5950 rebound near lower border of ascending channel
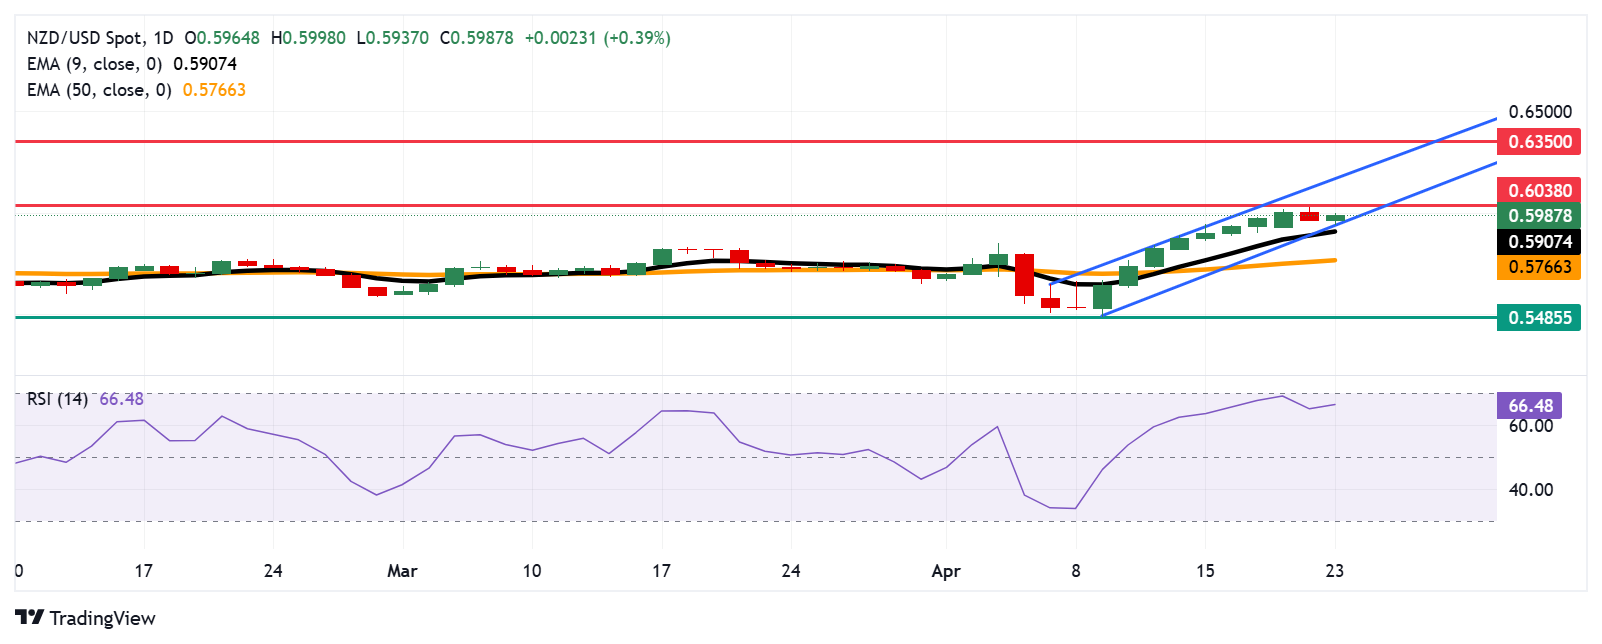
The New Zealand dollar (NZD/USD) may 0.6038 a key resistance level, which is a six-month high hit in November 2024. Technical analysis shows that the daily chart shows a bullish tendency, and the upward channel pattern is particularly significant. The preliminary support is located near the lower rail of the channel, about 0.5940.
Judging from the trend, the New Zealand dollar against the US dollar has recovered some of its losses in the previous trading day and traded near the 0.6000 mark in the European session on Wednesday. Daily level technical analysis shows that the exchange rate forms an upward channel structure and remains above the 9-day exponential moving average (EMA), reflecting the improvement in short-term price momentum. In addition, the 14-day relative strength index (RSI) is rising to the 70 level, further consolidating the overall bullish tone. However, an effective breakout of this value could prompt an overbought signal or exacerbate the risk of a short-term correction.
In the upward direction, the New Zealand dollar may challenge the 0.6038 resistance level (November 2024 high). If a sustained breakthrough is achieved, the exchange rate is expected to move up the channel. Once this resistance is successfully overcome, bullish expectations will strengthen further, followed by or pointing to near the seven-month high 0.6350 set in October 2024.
At the support level, the initial support is located in the lower rail of the ascending channel (about 0.5940), followed by EMA(0.5907) on the 9th. If it falls below these levels, short-term bullish momentum may weaken, further opening up the downside, the target can be looked at the 50-day moving average (0.5766). Lower support is seen in 0.5485-a low untouched since March 2020.
NZD/USD: Daily Chart


