GBP/JPY Price Analysis: Test the key resistance area located at the nine-day index moving average near 189.00
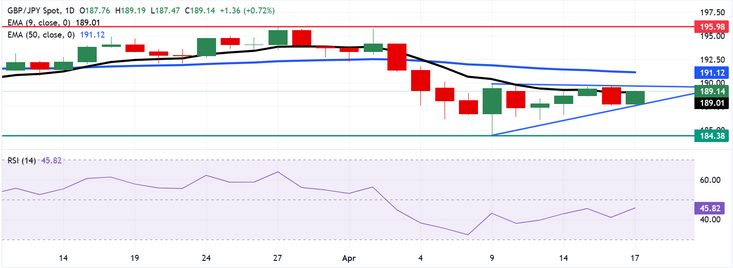
GBP/JPY recovered the recent losses of the previous session in early European trading on Thursday, trading around 188.90. The daily chart shows that the pair is fluctuating within a symmetrical triangle pattern, suggesting that a possible consolidation phase may lead to a breakout in either direction.
The 14-day Relative Strength Index (RSI), a key momentum indicator, remains below 50, indicating continued bearish pressure. In addition, the GBP/JPY currency pair is trying to break the 9-day exponential moving average (EMA). If a break through this level can be confirmed, it may enhance short-term bullish momentum.
The GBP/JPY currency pair may test this immediate support level 187.50 near the symmetrical triangle lower track trend line. If it falls below this level, it will send a bearish breakout signal, which may open the door for the currency to fall to the seven-month low 184.38, which was last seen on April 9.
On the upside, a break through the 9-day exponential moving average (188.96), which is 189.00 closely aligned with the psychological barrier, could provide bullish momentum for the GBP/JPY currency pair, paving the way for testing the level of 189.70 near the upper track trend line of the symmetrical triangle.
Breaking out of the symmetrical triangle could signal a bullish bias, perhaps pushing the GBP/JPY pair towards the 191.11 level where the 50-day exponential moving average is located. If it can continue to break this level, it may further open the way for the currency to challenge the 3-month high 196.10.
GBP/JPY: Daily Chart


